A Saama company that offers data analytics solutions and services for banking and capital markets, consumer goods, insurance, the public sector, and more.
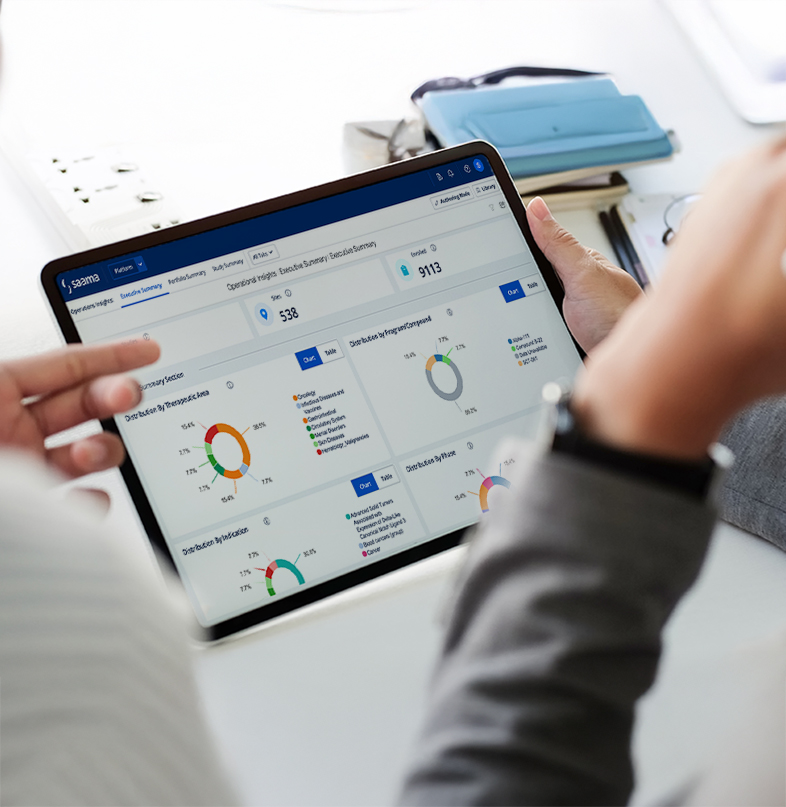
With Saama’s Operational Insights, AI automatically surfaces key trial insights. Centralized, role-specific dashboards allow users to quickly action these insights to efficiently advance trials and proactively mitigate risks. Unblock obstacles to study startup, improve decision making, monitor KPIs, assign and track tasks, and accelerate your time to market.
With all team members working from the same data, collaboration is simple. Easily assign tasks and set alerts, increasing collaboration within and between study teams.
Reduce time to action with AI generated insights
AI-generated summaries alert teams to issues that require action or further investigation. Directly assign tasks to drive team members to action, faster.
Accelerate study startup
Monitor and act on study, country, and site level start-up activities in a single location. Unblock any obstacle with real-time metrics and automatically tracked milestones.
Create and manage all KPIs centrally
Configure, approve, and manage KPIs in a single, integrated workflow. Compare metrics within and across studies with a centralized KPI library.
Quickly identify and remove roadblocks, accelerating time to study completion